
- Gold is down sharply this Friday as the US added more jobs than anticipated in November.
- Support is seen in the 1455/50 price zone.
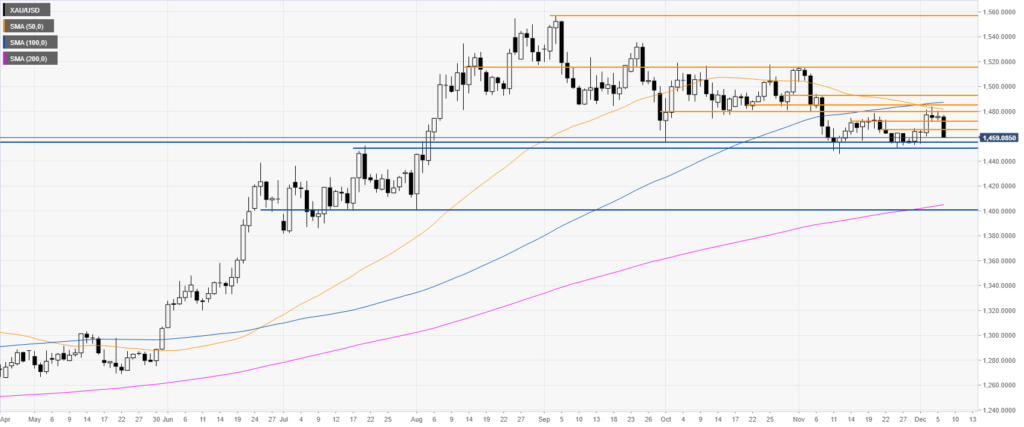
Gold daily chart
Gold is having a sharp intraday move down below the 50 and 100-day simple moving averages (SMAs) as the Nonfarm Payrolls (NFP) came in much better than anticipated with 266k vs. 180k expected.
Gold four-hour chart
The bears have taken control with the metal trading below its main SMAs. As the market is declining, the sellers will try to extend the current move down towards the 1455/50 zone on the way down. Resistance is seen at the 1465 and 1472 price levels.